a High Energy Physics Monte Carlo
generator for multi-jet processes.
Authors: Jeppe R. Andersen and Jennifer M. Smillie
The implementation of the HEJ resummation scheme and matching allows for concise predictions for multijet processes at hadron colliders.
The program for the generation (according to the HEJ framework) and analysis of multi-jet events can be downloaded and installed as described in the section for Installation.
The HEJ framework is developed particularly to describe the effects of many hard, radiative corrections. Such corrections obviously become increasingly important, as the centre-of-mass energy at colliders is increased.
The impact of the radiative corrections included in High Energy Jets on several important observables used in search strategies for New Physics is discussed further in arXiv:1101.5394.
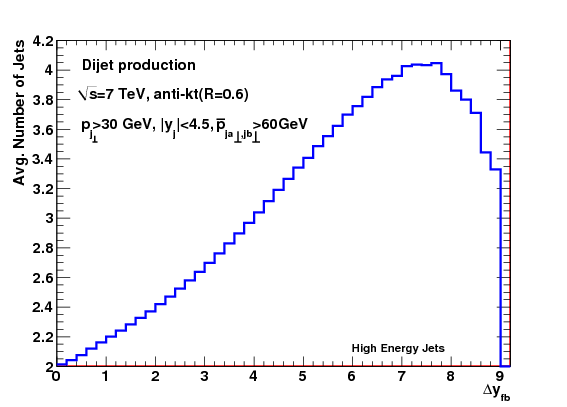
The hard radiative corrections are more important in certain phase space regions than others. One example of such a region is the region of large dijet invariant mass, or large rapidity differences. To illustrate the growing importance of hard radiative corrections, we plot below the average number of hard jets (pt>30GeV, |rapidity|<4.5), as a function of the rapidity difference between the most forward and most backward hard jet, as obtained with HEJ. This is one of the many results obtained by running the standard analysis in JetGen.

One sees that as the rapidity span between the most forward and most backward hard jets is increased, the events contain (on average) a steadily increasing number of hard jets. This is simply because, 1) the opening of phase space for such emissions, and 2) the mechanism (driven by a colour octet exchange between the dijets) for emission into this phase space. Eventually, though, the average number of jets drops back towards two because of phase space contraints.
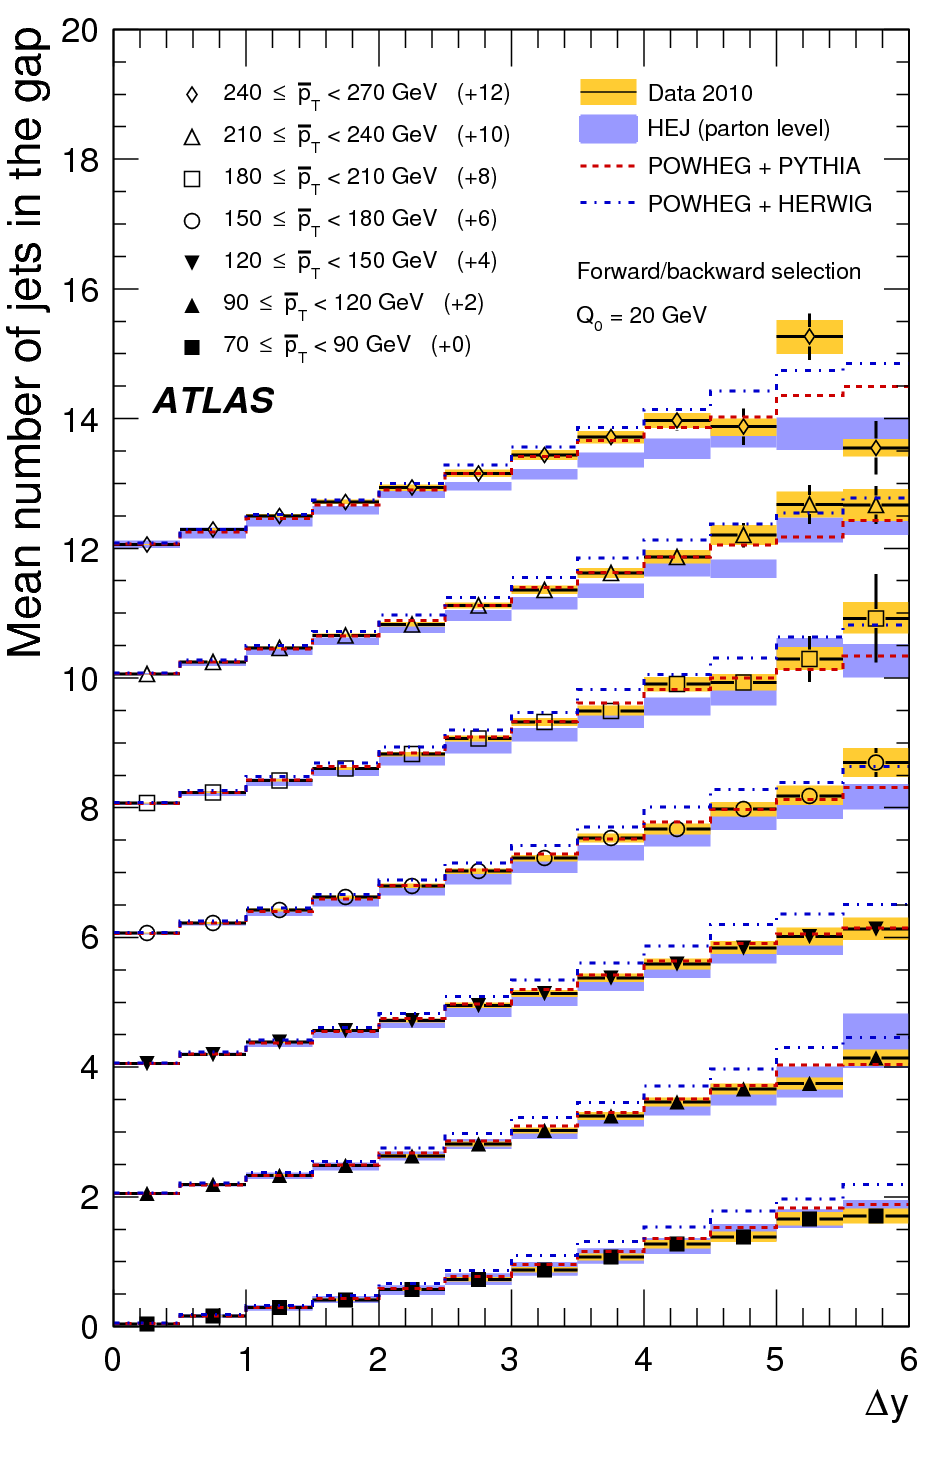
The average number of jets in events obtained when requiring just two was measured by ATLAS (arXiv:1107.1641) after the prediction made above. As seen on the figure below, the predictions from HEJ (in blue) are in good agreement with data (in yellow), particularly in the cases where there is no large hierarchy introduced in the transverse scales of the problem. [i.e. the results at the bottom of the plot is in complete agreement with data]
